


Analyze Mall-Specific Demand Drivers for Arcade Machines
Every mall operates as a distinct ecosystem, so blanket machine placement rarely succeeds. The first step is to understand the unique demand forces at play—from visitor movement patterns to demographic composition. Aligning arcade machines with these local drivers directly improves foot traffic conversion and revenue per machine.
Foot Traffic Flow, Dwell Time, and High-Conversion Zone Identification
Foot traffic volume alone is misleading; quality and flow matter more. Map the mall’s primary circulation routes, pinch points, and anchor store connectors. Zones with high throughput but low dwell time—such as main corridors—benefit from quick-play arcade machines that capture impulse decisions. In contrast, areas near food courts or children’s play zones naturally hold visitors longer, making them ideal for redemption or ticket-based games that reward repeated engagement. Observing where shoppers pause or congregate reveals high-conversion zones. Mall management often shares anonymized heat map data; combining that with manual observation over a two-week cycle yields a reliable baseline. Place machines where they invite interaction without obstructing movement—turning passive pathways into active engagement opportunities.
Demographic Alignment: Age Segments, Family Composition, and Spending Behavior
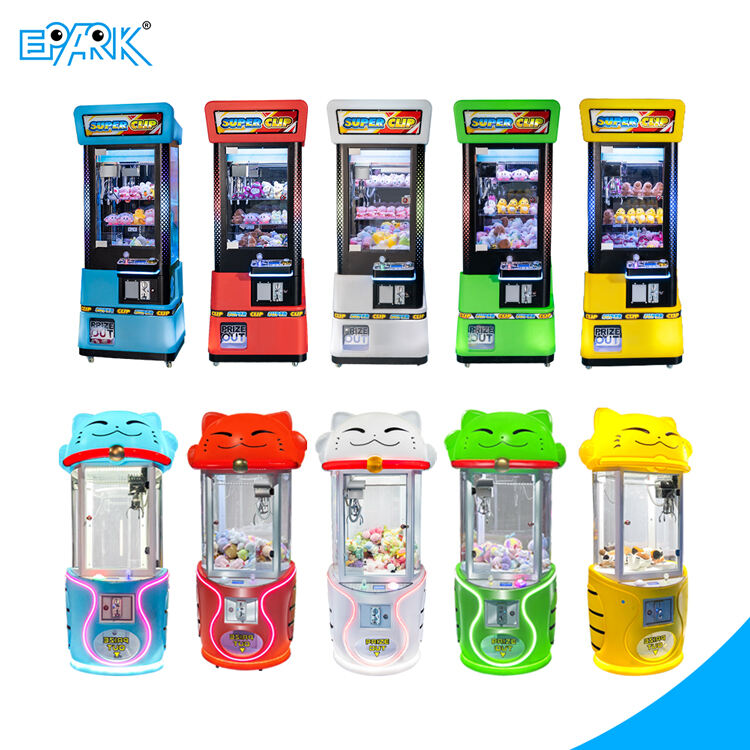
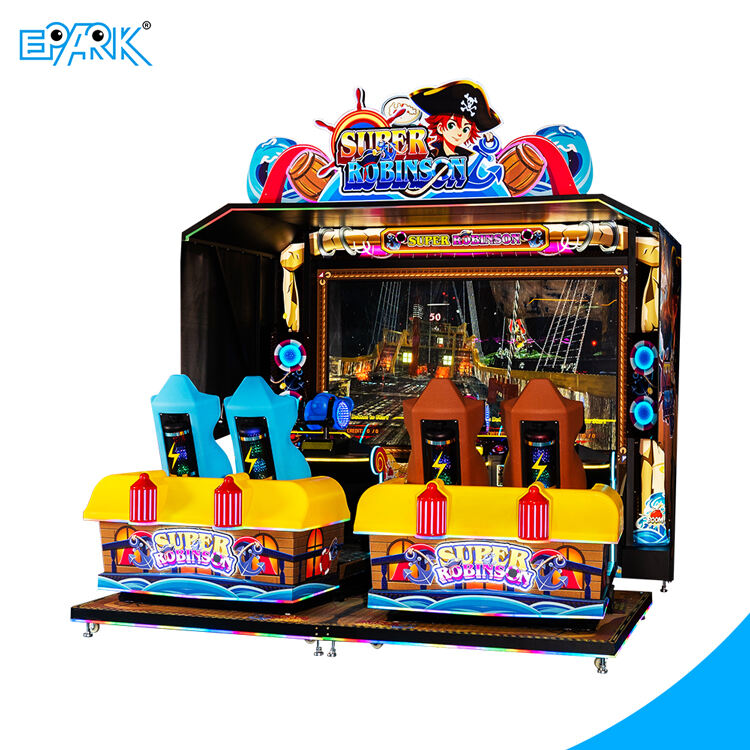
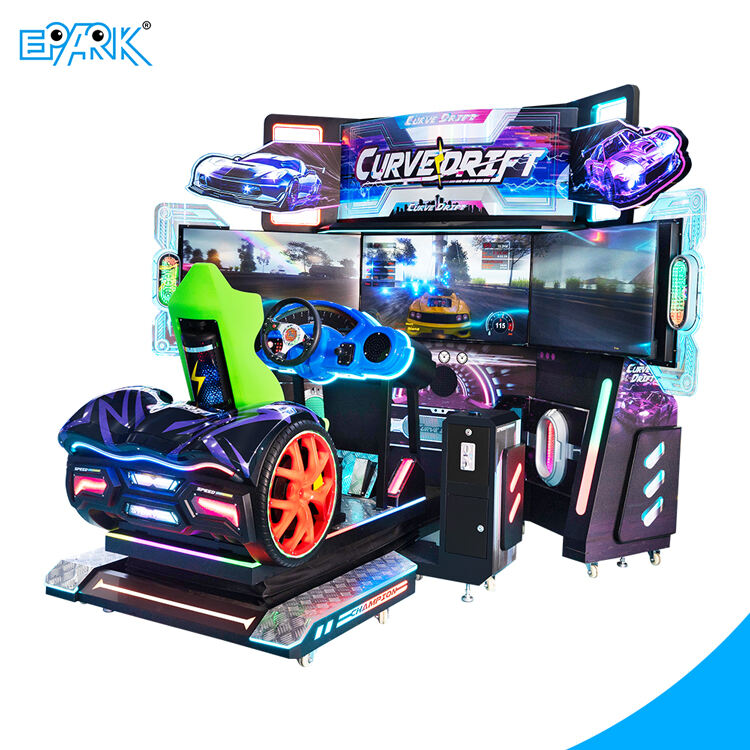
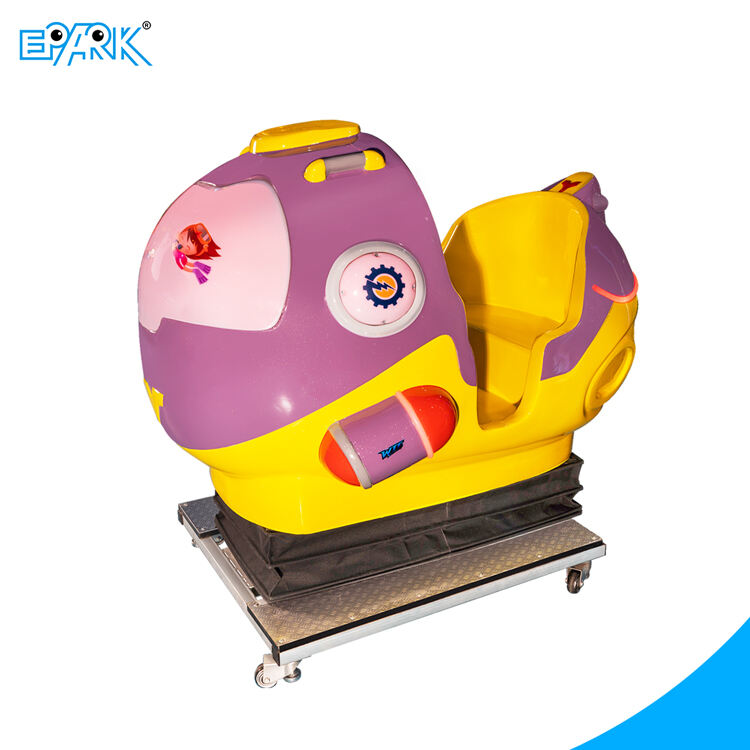
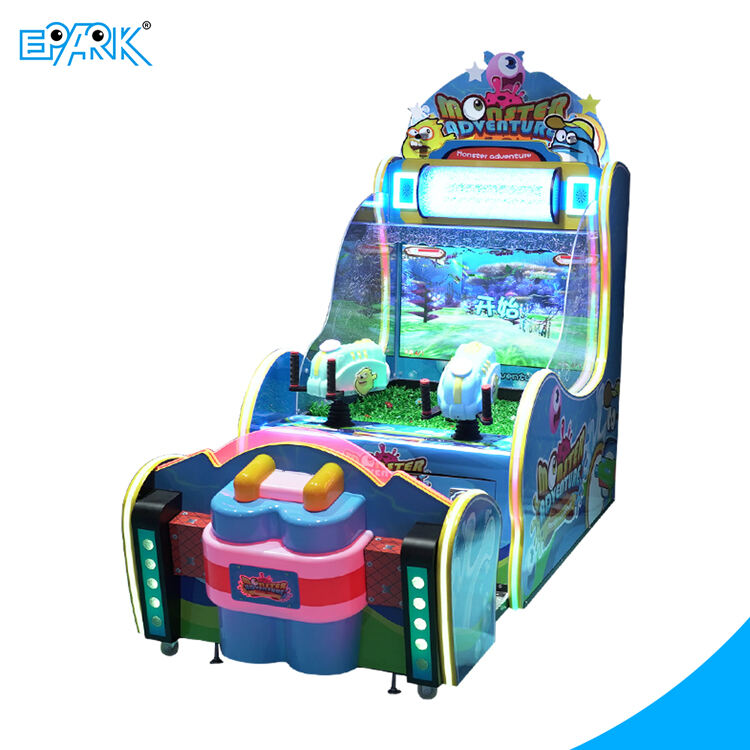
A mall anchored by luxury boutiques draws a different audience than one centered on family entertainment. Arcade machines must match the spending patterns and age profile of the daily visitor base. Malls with high family traffic perform best with claw machines and skill cranes offering small, affordable prizes—encouraging repeat plays. Teen- and young-adult–dominated malls see stronger returns from multiplayer competitive cabinets or racing simulators that foster social play. Suburban malls with significant senior traffic respond well to nostalgic or low-intensity ticket games. Anchor store customer profiles and local census data provide actionable demographic insights. By aligning machine themes, prize values, and game difficulty with the dominant age segment and family composition, operators increase both play frequency and average spend per visit.
Evaluate Arcade Machines by Retail-Environment Performance Metrics
When selecting arcade machines for a mall environment, operators must measure performance through two critical retail-specific lenses: long-term durability and revenue yield per square foot. The following breakdown helps align purchasing decisions with high-traffic demands.
Durability, Uptime Reliability, and Service Response Time for High-Traffic Malls
In bustling mall zones, machine reliability directly affects profitability. New arcade machines deliver longer trouble-free operation than refurbished units—78% of operators report improved uptime—but certified reconditioned equipment can reduce upfront costs by 30–40%. Key durability markers include steel body thickness of at least 1.2 mm, industrial-grade wiring, and certifications such as CE, UL, or FCC. A minimum 12-month warranty and guaranteed spare parts availability—especially for monitors and control panels—are essential. Even more critical is the supplier’s service response time: a mean-time-to-repair under 24 hours prevents revenue loss during peak hours. For multi-site operators, centralized spare-part kits and remote troubleshooting support further reduce downtime. Compliance with ADA accessibility standards ensures inclusive access across all visitor groups.
Revenue Per Square Foot (RPSF) Comparison Across Arcade Machine Categories
Comparing revenue per square foot helps operators prioritize machine types with the highest earning potential. Industry benchmarks for mall arcades show clear differences:
| Machine Category | Avg. Weekly Revenue per Sq. Meter ($) | Typical ROI (Months) |
|---|---|---|
| Redemption Games | 120 | 10–12 |
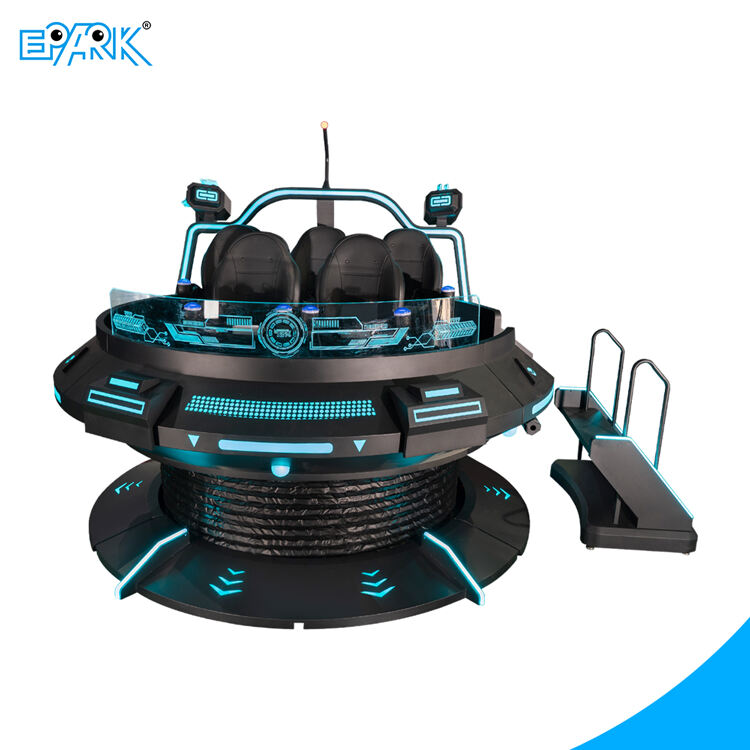
| VR & Simulators | 150 | 8–10 |
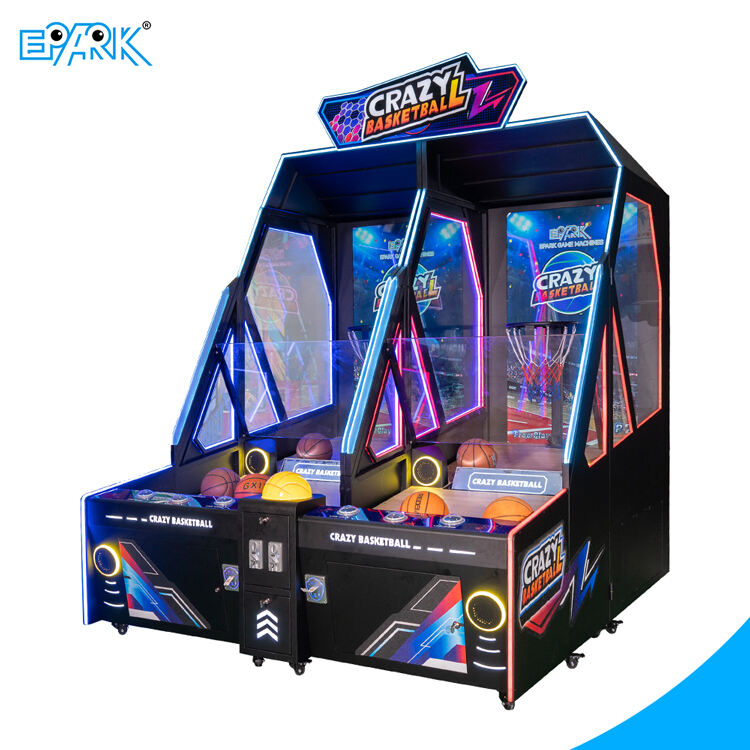
| Sports Games | 110 | 12–14 |
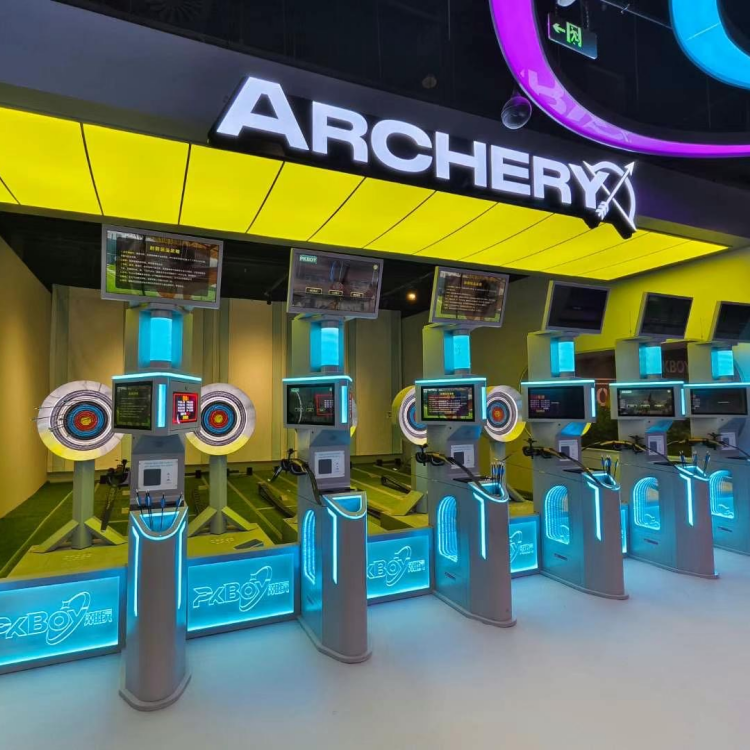
VR and simulators generate the highest weekly revenue per square meter, making them ideal for premium zones, while redemption games offer consistent returns with moderate space requirements. These figures allow operators to balance floor space allocation—placing high-earning categories near high-traffic corridors and family-friendly machines in secondary zones. The data also informs lease negotiations with mall management, as projected RPSF supports justification for premium rental rates.
Match Arcade Machines to Mall Zones and Adjacent Tenant Strategy
Place arcade machines in zones that complement nearby retail to boost foot traffic and play frequency. Thematic alignment ensures visitors naturally transition between experiences.
Thematic Synergy: Aligning Arcade Machine Content with Nearby Retail Brands
Pair arcade machines with adjacent stores that share a similar audience or theme. For example, placing a racing machine next to an automotive accessory shop—or a dance game near a sneaker retailer—creates a coherent visitor journey. This strategy increases stickiness: customers browsing one aisle are more likely to stop and play when the machine's topic matches the store’s merchandise. Retailers benefit from longer dwell times, too. A leading indoor entertainment operator found that machines thematically linked to neighboring tenants saw 15–20% higher daily play counts. When planning your arcade layout, review the mall’s tenant mix and assign high-conversion arcade machines to zones where synergy is strongest.
Optimize Arcade Machine Performance Through Data-Driven Iteration
Modern arcade operators can no longer rely on intuition alone. By integrating IoT-enabled monitoring and card-system analytics, managers gain real-time visibility into every machine’s performance—revealing which games generate the highest revenue per square foot, how often each unit is played, and when maintenance is needed to prevent downtime. With these insights, you can systematically rotate underperforming machines to high-traffic zones, adjust game difficulty to match player preferences, and refresh prize offerings to sustain excitement. Tracking key performance indicators—such as revenue per game, machine uptime, and redemption payout ratios—turns your arcade into a continuous feedback loop that boosts both player satisfaction and per-machine earnings.
FAQ
Why is foot traffic flow crucial for arcade machine placement?
Understanding foot traffic flow allows operators to identify high-conversion zones where arcade machines are more likely to engage visitors, resulting in increased interaction and profitability.
What factors should operators consider when choosing arcade machines for a mall?
Operators should evaluate machine durability, uptime reliability, demographic alignment, and revenue yield per square foot to maximize performance in mall environments.
How can thematic synergy enhance arcade machine performance?
Aligning arcade machine content with nearby retail brands creates a cohesive visitor experience, increasing dwell time and daily play counts.
Why is revenue per square foot a key metric for mall arcade operators?
Revenue per square foot helps operators prioritize high-performing machines and optimize floor space allocation for maximum profitability.
How can IoT and analytics improve arcade machine operations?
IoT-enabled monitoring and analytics offer real-time insights into performance metrics, enabling operators to make data-driven adjustments that boost revenue and minimize downtime.
Table of Contents
- Analyze Mall-Specific Demand Drivers for Arcade Machines
- Evaluate Arcade Machines by Retail-Environment Performance Metrics
- Match Arcade Machines to Mall Zones and Adjacent Tenant Strategy
- Optimize Arcade Machine Performance Through Data-Driven Iteration
-
FAQ
- Why is foot traffic flow crucial for arcade machine placement?
- What factors should operators consider when choosing arcade machines for a mall?
- How can thematic synergy enhance arcade machine performance?
- Why is revenue per square foot a key metric for mall arcade operators?
- How can IoT and analytics improve arcade machine operations?